
Some information restrictions were registered, particularly relevant in the case of the automotive transport (especially in the urban area), due to the atomization and unregulated operation that limits the systematic generation of statistics.
At the same time, the sector presents some characteristics that are virtually unique, and which differentiate it from the other productive sectors through the following:
› It is a non-storable service, highly specific in time and place
› It is done under different technical alternatives, which are not perfect substitutes among themselves.
› Joint attention to different demands
› Partition between infrastructure and mobility
› Strong institutional diversity, in terms of organization and state jurisdictions.
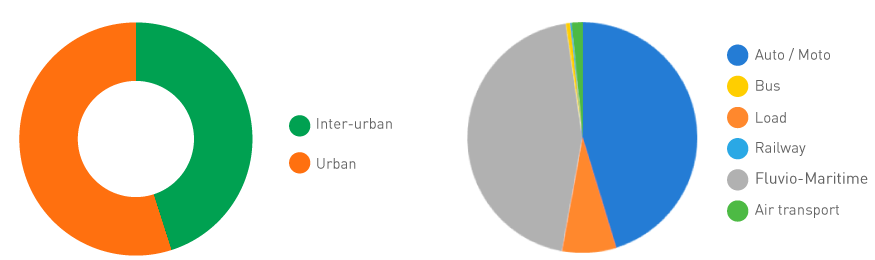
› 55% of the sector's energy consumption corresponds to URBAN TRANSPORT
› The energy consumption in the transport sector can mainly be explained by the consumption of auto-moto and cargo
› Motorized trips prevail in the larger centers, even though the motorcycle is a very used option at all levels.
› Collective transport is relevant only in larger centers.
› Urban freight transport generates little information. A transported volume of 480 million tons (7.200 million ton-km) has been estimated.
› Regarding the interurban passenger transport, the graph below summarizes the figures obtained through accounting data (rail and air transport) and estimations based on traffic census: the most used mode is the automobile.
› In the interurban transport of loads, the most relevant mode is the Heavy Truck Automotive, estimated according to accounting data for non-road modes, out of which the vehicle estimations were based on the traffic census (supplemented by estimations elaborated by the Ministry of Transport).
› Just like in the urban transport, in interurban flows the automotive industry prevails, both in passengers and cargo, which registers the greatest lack of information.
Energy consumption of the transport sector, by mode and type of fuel - thousands of tons of equivalent oil – 2017
Source: own elaboration*
* The total energy consumption in the transport sector obtained by the 2017 Energy Balance is 17,431 thousand tons of equivalent oil; the estimate made reasonably fits that total (the difference is less than 2%).


 EN
EN


